On our Windows laptop, WebGPURenderer r187 used 1.7× the CPU time of WebGLRenderer to render this 4,176-mesh scene, and took 2.2× as long for the first frame in a fresh browser with the shader disk cache disabled. The difference scales with the number of separate meshes: with BundleGroup and instancing WebGPURenderer dropped to 3.0 ms per frame. If your scene is many individual meshes, this result is likely relevant to you; measure on your own hardware before deciding.
What we compared, in brief
three.js ships two renderers. WebGLRenderer is the long-standing one, built directly on WebGL 2. WebGPURenderer is a separate, newer implementation built around node materials and TSL; it runs on WebGPU where the browser supports it and otherwise falls back to its own WebGL 2 backend. That gives three things to compare: WebGLRenderer, WebGPURenderer on WebGPU, and WebGPURenderer on its WebGL 2 backend (forceWebGL: true).
Three results from this test, each linked to the details:
- CPU per frame: 48 ms for WebGPURenderer against 28 ms for WebGLRenderer, with the same draw calls. Per mesh: about 3.0 µs vs 1.5 µs per frame. The WebGL 2 fallback was slowest at 62 ms.
- First frame: 1.5 s vs 665 ms in a fresh browser with the shader disk cache disabled; on a repeat visit with the shader disk cache enabled 767 ms vs 586 ms.
- What recovers it:
BundleGroupbrought WebGPURenderer to 8.0 ms, and to 3.0 ms with instancing — below WebGLRenderer with the same instancing (7.9 ms).
Also covered: why the two renderers produce slightly different pixels, what stops working when you switch, and the r182 shadow regression.
The scene and how it was measured
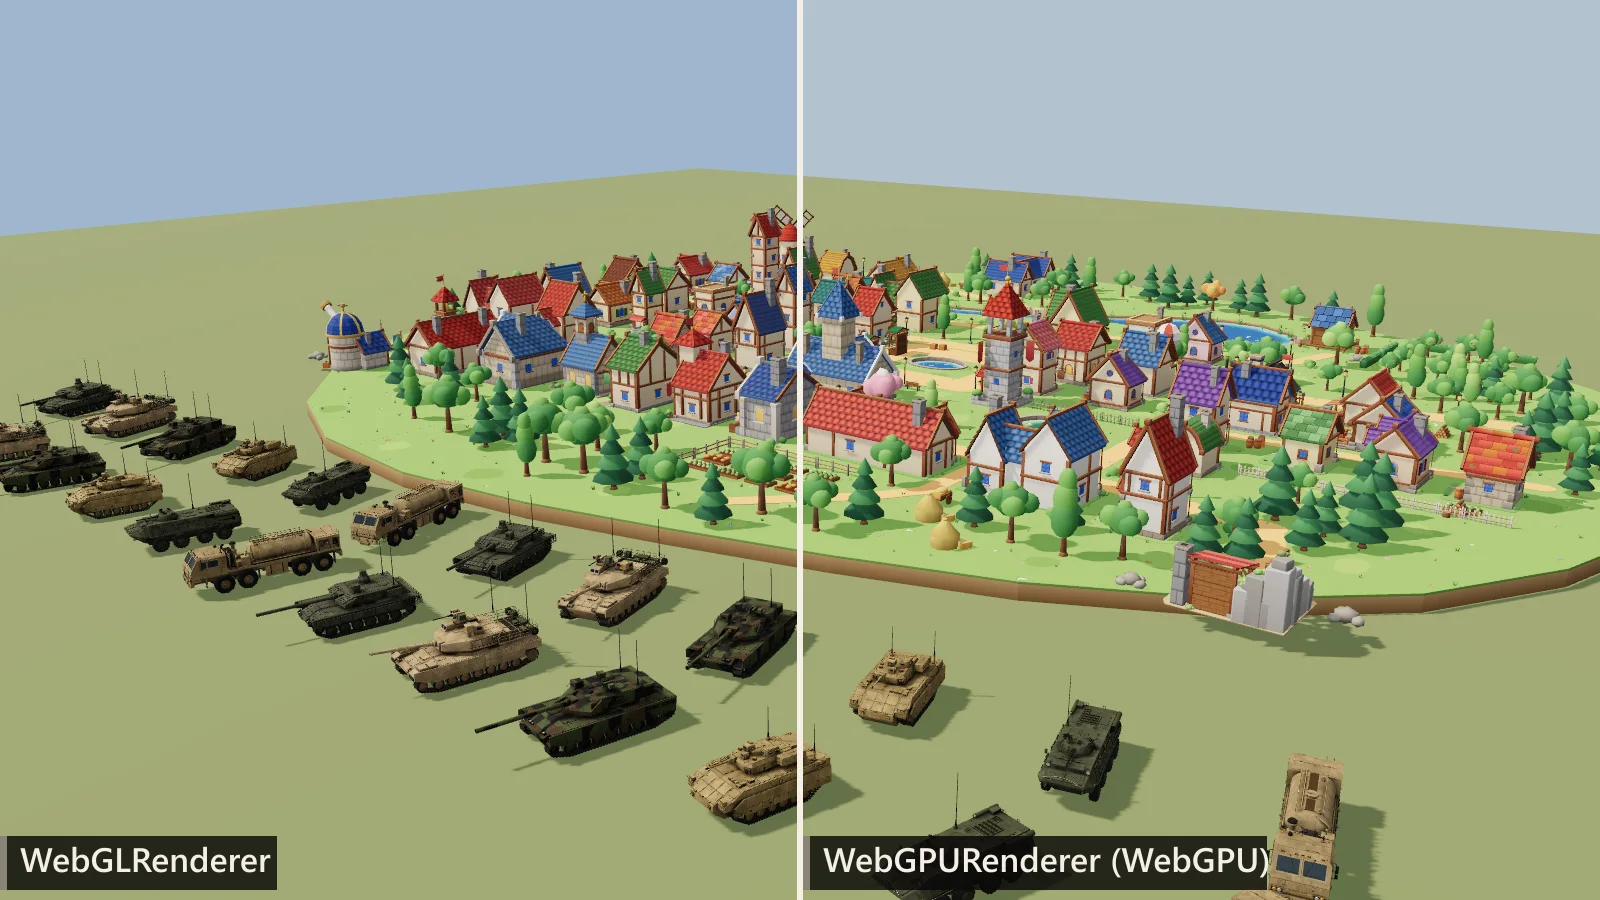
We wanted a scene that looks like a real project rather than a synthetic stress test: a low-poly village from the Cozy Town pack and a motor pool of 24 vehicles from the Military pack — six models, four copies each, every copy a full clone with its own meshes, as gltf.scene.clone() gives you. In these files every glTF node that references a mesh becomes its own Mesh object in three.js, so the village GLB (305 mesh definitions) becomes 375 meshes, and the vehicles 58 to 220 meshes each — wheels and track parts reuse one definition many times. With a ground plane that is 4,176 meshes.
| Value | |
|---|---|
| Meshes / draw calls per frame | 4,176 / 7,625 on the first frame and 8,251 on the last measured frame of WebGLRenderer (main pass + shadow pass; the count changes as the camera orbits). WebGPURenderer issued the same geometry draws plus one output pass |
| Triangles | 853,880 |
| Materials / geometries | 36 Mesh / 834 |
| Lighting | One Directional with a 2048² PCF shadow map, a Hemisphere, a PMREM environment from Room (a pre-filtered map used for reflections and ambient light), ACES tone mapping |
| Renderers | Web; Web on WebGPU; Web with force |
| CPU / memory | Intel Core i7-13700H (14 cores, 20 threads), 32 GB |
| GPU | NVIDIA GeForce RTX 4060 Laptop GPU, NVIDIA driver 566.26 (the integrated Intel GPU was not used) |
| Browser | Chrome 156.0.8078.80, headless; ANGLE → Direct3D 11 for WebGL, Dawn → Direct3D 12 for WebGPU |
| System | Windows 11 Pro, Balanced power plan, on mains power |
| Launch flags | --enable-unsafe-webgpu, --enable-webgpu-developer-features (unquantised GPU timestamps), --use-angle=default --enable-gpu; --disable-gpu-shader-disk-cache for every run except the first/repeat visit test |
| three.js | r187 for everything, plus r172, r178 and r182 for the history |
Each run starts a fresh browser, loads the models, then records the first frame, 240 animation frames for CPU time and frame interval, and 120 synchronised frames for GPU time. Runs of the different renderers are interleaved — run 1 of each, then run 2 of each — because a laptop CPU changes clocks over minutes. Absolute CPU times drifted by up to 30% between sessions on this machine; within every session, WebGPURenderer needed 1.5–2.1× the CPU time of WebGLRenderer for the same unmodified scene. Read the milliseconds as this laptop on this day.
The three metrics. CPU time is how long the JavaScript call renderer.render() takes: building and submitting the commands. GPU time is how long the graphics card spends executing them. Frame interval is the spacing between requestAnimationFrame callbacks in the test browser (headless Chrome); it is not a measurement of frames shown on a screen. CPU and GPU run in parallel — the GPU executes frame N while the CPU prepares frame N+1 — so the interval follows the slower of the two, not their sum. rAF ran at approximately 60 Hz, giving a minimum callback interval of about 16.7 ms.
A benchmarking trap: render() in a loop flatters WebGPURenderer
Our first numbers were wrong, and the way they were wrong matters for any WebGPU benchmark, including one you write yourself.
Calling render() 100 times in a tight loop and dividing is a common way to time a renderer. For WebGLRenderer it works: each call does the full work. WebGPURenderer keeps per-frame state in its node system and advances the frame from its own requestAnimationFrame loop (NodeFrame.update() is called by Animation, not by render()). Object-scope uniforms and other once-per-frame updates are skipped when the frame number has not changed, so the second and later calls in the same frame are much cheaper.
| Same town, same machine | WebGLRenderer | WebGPURenderer |
|---|---|---|
| render() called once per animation frame (a real app) | 28 ms | 48 ms |
| A second render() of the same scene in the same frame | 28 ms | 22 ms |
A tight loop therefore makes WebGPURenderer look 2.2× faster than it is in an application. All CPU numbers in this article come from one render() per animation frame, the way setAnimationLoop calls it. The flip side: re-rendering the same scene with the same camera in one animation frame was much cheaper on WebGPURenderer. We did not measure a second camera, another viewport or a separate render target, so this does not tell you what a minimap or split screen costs.
// Measure WebGPURenderer the way your app runs it: once per animation frame.
const times = [];
renderer.setAnimationLoop(() => {
  const t = performance.now();
  renderer.render(scene, camera);
  times.push(performance.now() - t);
  if (times.length === 240) {
    renderer.setAnimationLoop(null);
    times.sort((a, b) => a - b);
    console.log('median render()', times[120].toFixed(2), 'ms, p90', times[216].toFixed(2), 'ms');
  }
});
CPU time and frame interval: one scene, three renderers
Scroll the chart sideways →
The same town: CPU time of render() and frame interval (lower is better)
- CPU: render(), median
- CPU: render(), 90th percentile
- Interval between rAF callbacks, median
renderer.render(). The frame interval is the spacing of rAF callbacks in headless Chrome; rAF ran at approximately 60 Hz, giving a minimum callback interval of about 16.7 ms. It is not a measurement of frames shown on a screen. The 90th percentile is the median of the per-run 90th percentiles. CPU and GPU work overlap, so the frame interval is not their sum. Intel Core i7-13700H, NVIDIA GeForce RTX 4060 Laptop GPU, Chrome 156, Windows 11, three.js r187, 1600×900, MSAA 4×.All values, with per-run spread
| Renderer | CPU median (run medians) | CPU p90 | Frame median | Frame p90 | Draw calls (first → last frame; WebGPU incl. output pass) |
|---|---|---|---|---|---|
| WebGLRenderer | 28 ms (23 ms–30 ms) | 36 ms | 33 ms | 33 ms | 7,625 → 8,251 |
| WebGPURenderer | 48 ms (39 ms–53 ms) | 64 ms | 50 ms | 67 ms | 7,626 → 8,252 |
| WebGPURenderer forceWebGL | 62 ms (53 ms–63 ms) | 76 ms | 67 ms | 83 ms | 7,626 → 8,252 |
WebGPURenderer spent a median 48 ms in render() against 28 ms for WebGLRenderer — 1.7×. The slow frames widen the gap: the 90th percentile (median of the per-run 90th percentiles) was 64 ms against 36 ms. rAF callbacks came every 50 ms (WebGPURenderer) and 33 ms (WebGLRenderer) — whole multiples of 16.7 ms. Our reading: a frame that misses a 60 Hz tick waits for the next one.
Both renderers issued the same geometry draws — WebGLRenderer 7,625 on the first frame and 8,251 on the last measured frame; WebGPURenderer one more on each, for its output pass — so the difference is cost per draw, not extra work. WebGPURenderer on its WebGL 2 backend was slower still: 62 ms median, 76 ms at the 90th percentile.
GPU time: what this method can and cannot show
We measured GPU time too, but the two renderers expose it through different mechanisms that measure different intervals, so the raw numbers are not directly comparable:
| Renderer | Mechanism | What it includes | Median (run medians) |
|---|---|---|---|
| WebGLRenderer | EXT_disjoint_timer_query_webgl2 around render() | From the first to the last command on the GPU timeline, including idle gaps while the GPU waits for commands from a slower CPU | 21 ms (16 ms–29 ms) |
| WebGPURenderer | The renderer’s timestamp queries (track) | Start to end of each render pass, written after the pass was encoded; no CPU gaps. Bimodal on this laptop as the GPU switched clock states | 6.0 ms (2.8 ms–7.4 ms) |
| WebGPURenderer, forceWebGL | Timer query inside its WebGL 2 backend | Same caveat as WebGLRenderer | 67 ms (62 ms–76 ms) |
To get a comparable number we tried to make each renderer GPU-bound: the instanced town (less CPU work), 40 frames rendered back to back, then wait for the GPU. When the GPU is the bottleneck, time per frame is GPU time.
- WebGPURenderer with a
BundleGroupsubmitted a frame in 0.35 ms of CPU and finished one every 2.9 ms at 3200×1800. That is GPU-bound, so about 2.9 ms is its GPU cost for this scene. - WebGLRenderer finished a frame every 7.2 ms but spent 6.5 ms submitting it — still CPU-bound. Its GPU time is somewhere below 7.2 ms; we could not pin it down further.
- Quadrupling the pixels from 1600×900 changed little for either (WebGL 6.8 ms → 7.2 ms, WebGPU 4.5 ms → 5.0 ms): a low-poly scene with standard materials is light on per-pixel work.
What this supports: the original town scene was limited by the CPU on both renderers. In the optimised throughput test (instancing + BundleGroup) WebGPURenderer became GPU-bound at about 2.9 ms per frame — far below its 48 ms of CPU time in the original scene. WebGLRenderer stayed CPU-bound even when instanced. What it does not support: a ranking of the two renderers’ GPU cost. That needs a scene in which both are confirmed GPU-bound, which this one is not.
Where WebGPURenderer spends the CPU time
A CPU profile of 90 frames (Chrome DevTools protocol, 0.1 ms sampling) shows where the time was spent. Self time per frame, top ten functions:
| WebGLRenderer, 26 ms per frame | Self time |
|---|---|
needs three.module | 4.9 ms |
setup three.module | 1.8 ms |
project three.module | 1.8 ms |
Web three.module | 1.5 ms |
render three.module | 1.5 ms |
copy three.module | 1.3 ms |
render three.module | 1.2 ms |
update three.core | 1.2 ms |
intersects three.core | 0.94 ms |
multiply three.core | 0.92 ms |
| WebGPURenderer, 46 ms per frame | Self time |
|---|---|
_render three.webgpu | 5.4 ms |
get three.webgpu | 2.7 ms |
project three.webgpu | 2.5 ms |
draw three.webgpu | 2.5 ms |
equals three.tsl | 2.5 ms |
_draw three.webgpu | 2.4 ms |
set native API call | 2.3 ms |
get needs three.webgpu | 2.2 ms |
needs three.webgpu | 2.0 ms |
update three.webgpu | 1.9 ms |
Our reading of the profile, together with the three.js source:
- Change detection per object, per frame. For every mesh WebGPURenderer checks whether its pipeline, geometry or bindings need updating (
needsRenderUpdate,needsGeometryUpdate,needsRefresh,equals, cache lookups inget). WebGLRenderer does a lighter equivalent: its top two entries,needsUpdateandsetup, are the vertex-array cache inWebGLBindingStates.js. - A uniform buffer and bind group per object. A uniform buffer is a block of GPU memory with values for the shader, such as the model matrix; a bind group is WebGPU’s unit for attaching such buffers and textures to a draw. Object-scope uniforms live in a uniform buffer per object (
objectGroupinUniformGroupNode.js), updated and bound per draw. The three.js maintainers describe this bottleneck in issue #30560. - More native calls per draw. Each WebGPU draw here involves
setBindGroup(several),setVertexBufferper attribute,setIndexBuffer,setPipelineand the draw. Those four calls took 6.3 ms of self time per frame; the three GL calls in WebGLRenderer’s top 25 (uniformMatrix4fv,drawElements,bindVertexArray) took 2.4 ms. The sampling profile shows that time sits in these calls; it does not split it into argument validation, serialisation to Chrome’s GPU process and driver work.
None of this says the WebGPU API is slower in principle. WebGPU is designed for draws that are recorded once and replayed, which is what BundleGroup uses.
Cost per mesh: the many-object scenes
Scroll the chart sideways →
Separate meshes, one shared material: CPU time of render() per frame (log scale)
- WebGPURenderer (WebGPU)
- WebGLRenderer
All values
| Meshes | WebGL CPU | WebGPU CPU | ratio | WebGL first frame | WebGPU first frame |
|---|---|---|---|---|---|
| 1,000 | 1.1 ms | 2.0 ms | 1.8× | 55 ms | 175 ms |
| 4,000 | 3.9 ms | 7.4 ms | 1.9× | 56 ms | 276 ms |
| 10,000 | 12 ms | 25 ms | 2.0× | 70 ms | 435 ms |
| 20,000 | 30 ms | 60 ms | 2.0× | 91 ms | 661 ms |
To isolate the per-object cost we removed everything else: N separate meshes, eight tiny geometries, one material, no shadows. From 1,000 to 20,000 meshes WebGPURenderer added about 3.0 µs of CPU per mesh per frame, WebGLRenderer about 1.5 µs. At 20,000 meshes that is 60 ms against 30 ms.
Spreading the 10,000 meshes over 200 materials that share one shader and differ only in colour did not add measurable cost: WebGLRenderer 9.6 ms vs 12 ms with one material, WebGPURenderer 25 ms vs 25 ms. This test does not cover materials with different textures, shader variants or render states, which add their own switching cost. The WebGL 2 fallback at 10,000 meshes: 25 ms.
The first frame grows with the object count much faster on WebGPURenderer: at 20,000 meshes it took 661 ms against 91 ms for WebGLRenderer (7.3×), at 1,000 meshes 175 ms against 55 ms. That matches the “5–10× slower first frame on many-mesh scenes” reported on the forum.
The first frame
Scroll the chart sideways →
First frame of the town, fresh browser, shader disk cache disabled (lower is better)
- render() straight away: until the GPU is done
- … longest main-thread block
- compileAsync() first: until the GPU is done
- … longest main-thread block
--disable-gpu-shader-disk-cache. Time from the call until the GPU reports all work done (readPixels / queue.onSubmittedWorkDone()); the block is the longest task reported by the Long Tasks API in that window. Models were already parsed; texture upload, buffer creation and shader/pipeline compilation are inside. Medians of 5 runs. Intel Core i7-13700H, NVIDIA GeForce RTX 4060 Laptop GPU, Chrome 156, Windows 11, three.js r187, 1600×900, MSAA 4×.All values
| Renderer | render(): total | render(): JS | longest block | compileAsync(): total | of which compileAsync | longest block | init() |
|---|---|---|---|---|---|---|---|
| WebGLRenderer | 665 ms | 658 ms | 665 ms | 401 ms | 146 ms | 249 ms | 10 ms |
| WebGPURenderer | 1.5 s | 732 ms | 732 ms | 1.5 s | 988 ms | 279 ms | 85 ms |
| WebGPURenderer forceWebGL | 2.2 s | 2.2 s | 2.2 s | 1.5 s | 668 ms | 775 ms | 11 ms |
The first render() of a scene compiles every shader variant, uploads every texture and buffer and builds every pipeline. In a fresh browser with the shader disk cache disabled, WebGLRenderer finished in 665 ms; WebGPURenderer needed 1.5 s, of which 732 ms was JavaScript inside render() and the rest waiting for the GPU process to create pipelines and upload data. The WebGL 2 fallback took 2.2 s.
With the shader disk cache enabled, using the same browser launch flags (headless Chrome, WebGPU flags), the picture changes on a repeat visit. We ran the same page in a new browser profile (empty caches), closed the browser and opened the page again with the same profile. First visit: WebGLRenderer 710 ms, WebGPURenderer 1.7 s. Repeat visit: 586 ms and 767 ms — the gap fell from 2.5× to 1.3×, most likely because Chrome reused compiled pipelines from its shader disk cache — the setting our controlled runs disable. (Medians of 3 profiles each.) A new profile is one specific condition, not a proven upper bound for real visitors.
compileAsync() reduces the longest main-thread block for both renderers: WebGLRenderer from 665 ms to 249 ms, WebGPURenderer from 732 ms to 279 ms (it requests pipelines with createRenderPipelineAsync() and yields between steps). 279 ms is still a visible hitch, and the total time to the first finished frame barely changed on WebGPU (1.5 s). Keep a loader on screen through compilation and the first render() call:
import * as THREE from 'three/webgpu';

const renderer = new THREE.WebGPURenderer({ antialias: true });
await renderer.init();                       // required before render() in r18x

showLoader();
scene.add(await loadEverything());
await renderer.compileAsync(scene, camera);  // fewer, shorter main-thread blocks; not zero

let first = true;
renderer.setAnimationLoop(() => {
  renderer.render(scene, camera);           // first call still uploads and finishes setup
  // render() returns once commands are submitted; hiding on the next animation frame
  // is a simple heuristic, not proof that the GPU finished or the frame was displayed
  if (first) { first = false; requestAnimationFrame(hideLoader); }
});
Objects added later compile on the frame they first appear; call compileAsync(object, camera, scene) for them before adding them, as described in our article on shader recompilation. If you must know that the GPU has finished, wait for device.queue.onSubmittedWorkDone() on WebGPU (our first-frame numbers do this) or a 1-pixel readPixels on WebGL; even that confirms GPU completion, not that the frame reached the screen.
Getting the CPU time back
Scroll the chart sideways →
CPU time of render() per frame after each change (lower is better)
- WebGLRenderer
- WebGPURenderer (WebGPU)
All values
| Change | WebGL CPU | WebGL draw calls | WebGPU CPU | WebGPU draw calls | WebGPU first frame |
|---|---|---|---|---|---|
| As built: 4,176 meshes | 28 ms | 7,625 | 48 ms | 7,626 | 1.5 s |
| Shadows off | 13 ms | 3,450 | 19 ms | 3,451 | 1.1 s |
| Static matrices (matrixAutoUpdate off) | 22 ms | 7,625 | 40 ms | 7,626 | 1.5 s |
| Vehicles as InstancedMesh | 7.9 ms | 2,651 | 13 ms | 2,652 | 1.3 s |
| BundleGroup (WebGPU only) | — | — | 8.0 ms | 8,352 | 1.4 s |
| BundleGroup + InstancedMesh | — | — | 3.0 ms | 2,652 | 1.3 s |
The per-object cost points at the fixes. They help both renderers, and WebGPURenderer more, because that is where its extra cost is.
BundleGroup(WebGPU only): 48 ms → 8.0 ms. A render bundle is a pre-recorded list of GPU commands that can be replayed. Meshes inside aTHREE.BundleGroupare recorded once; on later frames WebGPURenderer replays the bundle instead of encoding each draw again. It still walks the bundle’s render objects and callsneedsRefreshon each, updating uniforms and bindings that changed (Renderer._renderBundle), so per-object work shrinks rather than disappears. Objects inside a bundle are not frustum-culled individually, and structural changes — adding, removing, swapping materials — needbundle.needsUpdate = true, which re-records it.- Instancing: the 24 vehicles as one
InstancedMeshper part cut the town from 7,625 to 2,651 draw calls. WebGPURenderer: 13 ms; WebGLRenderer: 7.9 ms. With a bundle on top WebGPURenderer reached 3.0 ms, below WebGLRenderer with the same instancing. For when to instance, merge or batch, see InstancedMesh vs merged geometry vs BatchedMesh. - Static matrices (
matrixAutoUpdate = falseon everything,scene.matrixWorldAutoUpdate = false): WebGL 22 ms, WebGPU 40 ms. A small win, cheap to apply to a static scene. - Shadows off removes the shadow pass and halves the draw calls (7,625 → 3,450): WebGL 13 ms, WebGPU 19 ms. Not a fix, but it shows the shadow pass costs CPU in proportion to its draws. A tighter shadow camera, or no
castShadowon small props, buys part of it back.
import * as THREE from 'three/webgpu';

// Static level geometry: recorded once, replayed every frame.
const staticWorld = new THREE.BundleGroup();
staticWorld.add(village, ...parkedVehicles);
scene.add(staticWorld);

// After adding, removing or re-materialing anything inside it:
staticWorld.needsUpdate = true;   // re-records the bundle on the next render

// Keep moving things outside the bundle.
scene.add(player, projectiles);
BundleGroup skips per-object frustum culling: everything inside is drawn every frame, on- or off-screen. In our town nearly everything is on screen; for a large level, use one bundle per area so whole areas can be hidden.
Same scene, slightly different pixels
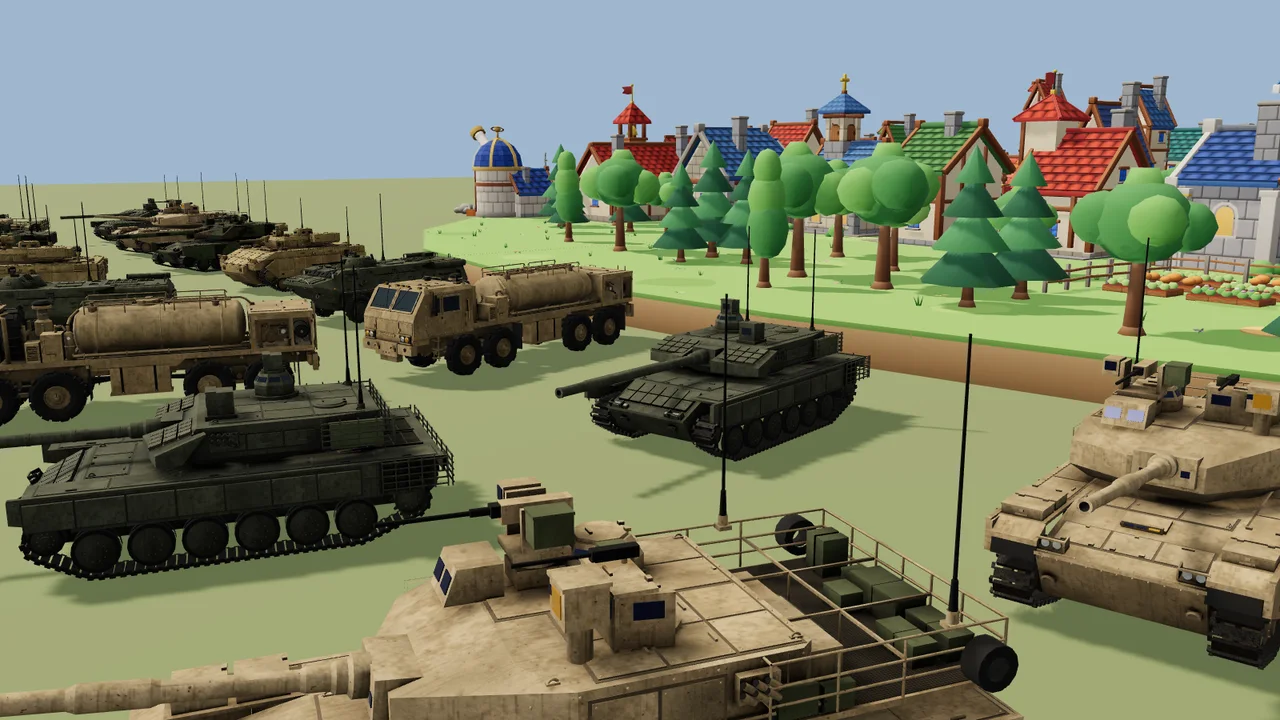
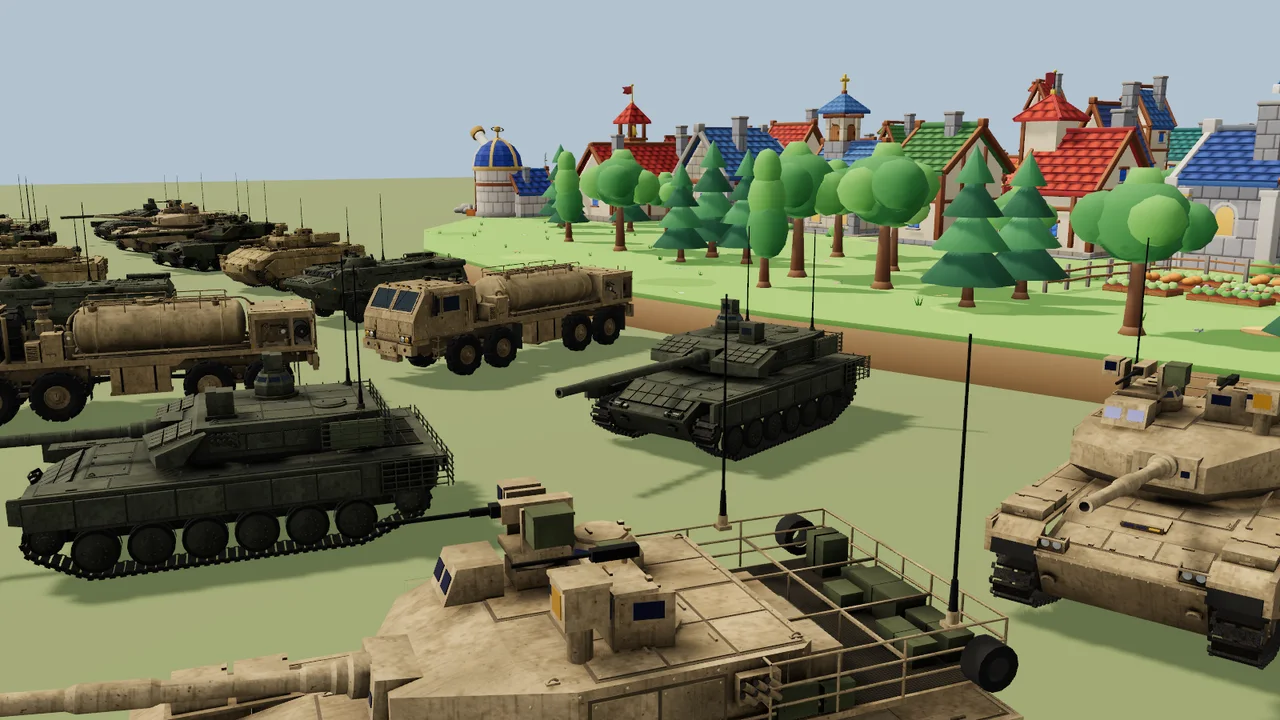
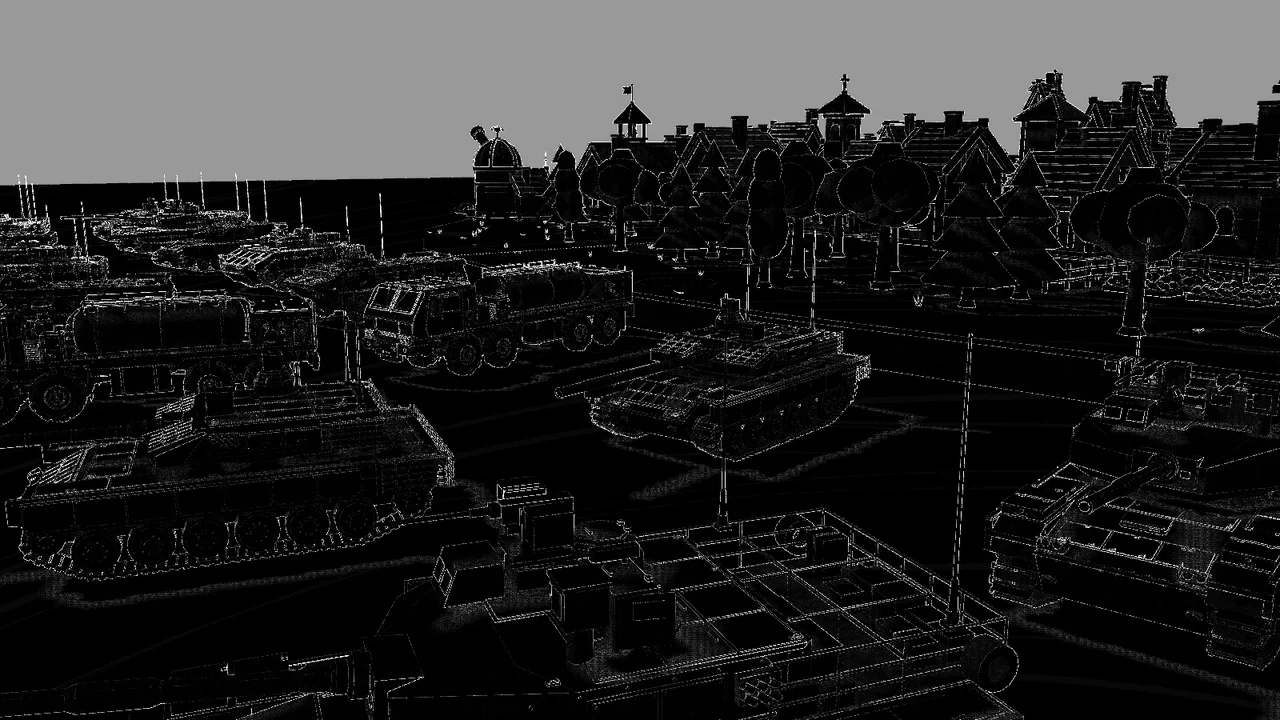
Out of all pixels, 23.71% differ by more than 8/255 in some channel. Almost all of that comes from two systematic causes; on flat, non-edge surfaces outside the sky only 0.39% of pixels differ by more than 8/255.
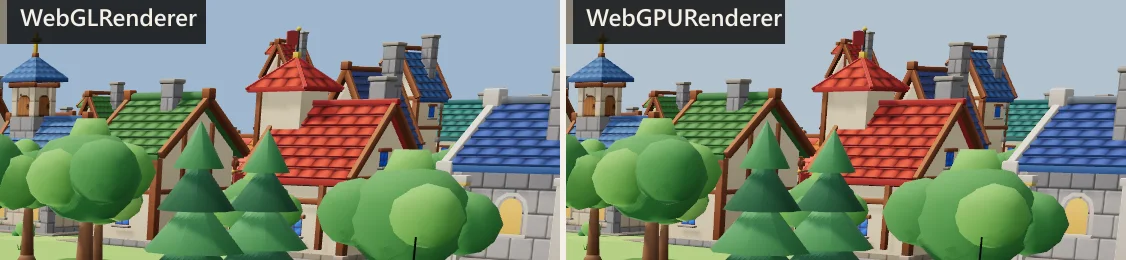
1. The background is tone mapped in WebGPURenderer. Our scene.background is #9fb7cf. WebGLRenderer clears the canvas to that exact colour: (159, 183, 207). WebGPURenderer renders the scene, background included, into a half-float target and applies tone mapping and the sRGB conversion in a separate output pass, so the background goes through ACES too: (178, 194, 207). With NoToneMapping both give (159, 183, 207). If the background is a brand colour, it will shift after the switch.
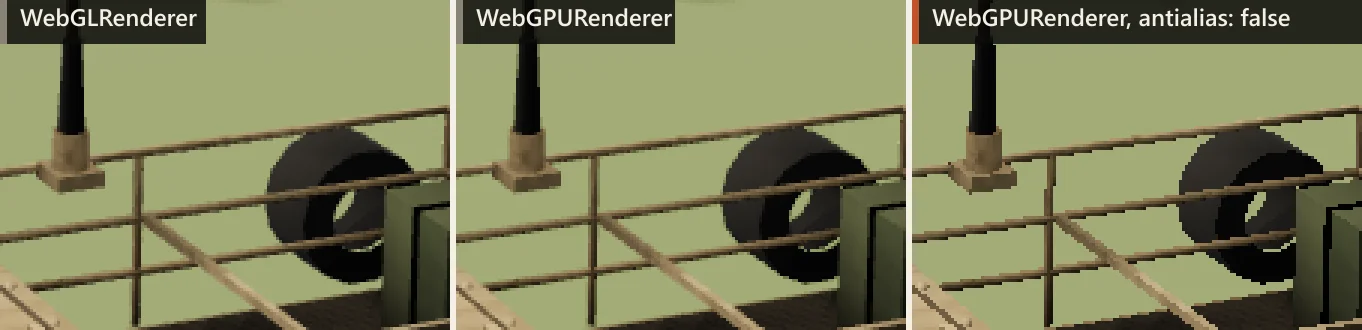
scene.background colour: WebGL clears to it, WebGPU tone-maps it.2. MSAA resolves before tone mapping in WebGPURenderer. WebGLRenderer tone-maps inside every material shader and resolves the multisampled buffer afterwards, in display space. WebGPURenderer resolves the half-float target in linear space and tone-maps after; the three.js source calls the separate pass “more correct”. Bright-dark edges get slightly different weights, so thin geometry — antennas, rails — looks a touch heavier or lighter. 94.6% of the differences outside the sky are on edges.
antialias the rails break into steps.What breaks when you switch, and the WebGL 2 fallback
Built-in materials, lights, shadows, loaders and most of the core API work on WebGPURenderer: our whole scene ran unchanged on the WebGPU build. The gaps are custom shaders and post-processing, and one of them fails silently. We ran the ShaderMaterial, onBeforeCompile and init() cases on r187; the other rows follow the source and the migration guide:
Scroll the table sideways for all columns →
| Feature | On WebGPURenderer r187 | Replacement |
|---|---|---|
Shader (GLSL); Raw has no node equivalent either | Not rendered; warning “Material "ShaderMaterial" is not compatible” | Node materials and TSL; WGSL through wgsl |
material. | Silently ignored: the material renders without your patch, no warning | color, position, normal … on a node material |
Effect and its passes | Not supported | Render (named Post before r183) with TSL pass nodes |
renderer. right after construction | Throws: call await renderer. first | await init() or set |
| Built-in materials, GLTFLoader, shadows, PMREM, InstancedMesh, BatchedMesh | Work unchanged; converted to node materials automatically | — |
WebGL-specific code: renderer., extensions, raw GL state | Not available on the WebGPU backend | Renderer-level APIs; compute shaders for GPU work |
A typical onBeforeCompile patch — a height-based colour blend, say — becomes a few lines of TSL that run on both of WebGPURenderer’s backends:
import { MeshStandardNodeMaterial } from 'three/webgpu';
import { color, mix, positionWorld, smoothstep } from 'three/tsl';

const ground = new MeshStandardNodeMaterial({ roughness: 0.9 });
// was: onBeforeCompile + string replace in the fragment shader
ground.colorNode = mix(color(0x6b5a45), color(0x7d8a5c), smoothstep(0.0, 2.0, positionWorld.y));
The WebGL 2 fallback. When WebGPU is unavailable — older Safari and Firefox versions, some Linux and Android GPU/driver combinations, locked-down enterprise browsers — WebGPURenderer switches to its own WebGL 2 backend: the same node-material system on top of WebGL. In our tests it was the slowest of the three: 62 ms CPU per frame against 28 ms for WebGLRenderer, and 2.2 s for the first frame. If many of your users lack WebGPU, a WebGLRenderer build may serve them better — which means keeping materials both renderers understand (the built-in ones; TSL node materials do not run on WebGLRenderer).
const renderer = new THREE.WebGPURenderer({ antialias: true });
await renderer.init();
if (!renderer.backend.isWebGPUBackend) {
  // WebGPU unavailable: this renderer now runs on its WebGL 2 backend.
  // Log it, lower quality, or load a WebGLRenderer build of the app.
}
React Three Fiber: v9 accepts an async gl factory, so gl={async (props) => { const r = new WebGPURenderer(props); await r.init(); return r; }} works; performance is the renderer’s, as measured here. drei helpers that use ShaderMaterial or onBeforeCompile fall under the table above.
Which renderer to ship
- Scenes built from many separate meshes and stock materials: WebGLRenderer was the cheaper choice in this test — 1.7× less CPU per frame and a shorter first frame — and it runs wherever WebGL 2 does, including browsers and devices without WebGPU.
- WebGPURenderer for what only it offers: compute shaders, storage buffers, GPU particles and simulations, indirect draws, TSL as one shader language for both backends. Then design for it: instancing or
BatchedMeshfor repeats,BundleGroupfor static geometry,compileAsync()behind a loader. - Measure your own scene on the slowest device you support, with one
render()per animation frame, both a first and a repeat visit, and the 90th percentile next to the median. - Check the pixels after switching: background colour, thin geometry, shadow softness and
bias. - Plan the fallback:
forceWebGLnumbers are what users without WebGPU will see.
All numbers come from one machine (Intel Core i7-13700H, NVIDIA GeForce RTX 4060 Laptop GPU, Chrome 156, Windows 11, three.js r187, 1600×900, MSAA 4×, Balanced power plan). Another CPU, GPU, driver or browser can change the size of every difference here, and we have not verified that the direction holds elsewhere. The bench code, raw results and screenshots are kept with the article; the scene uses our own packs.
Shadows: the r182 regression and what PCF looks like now
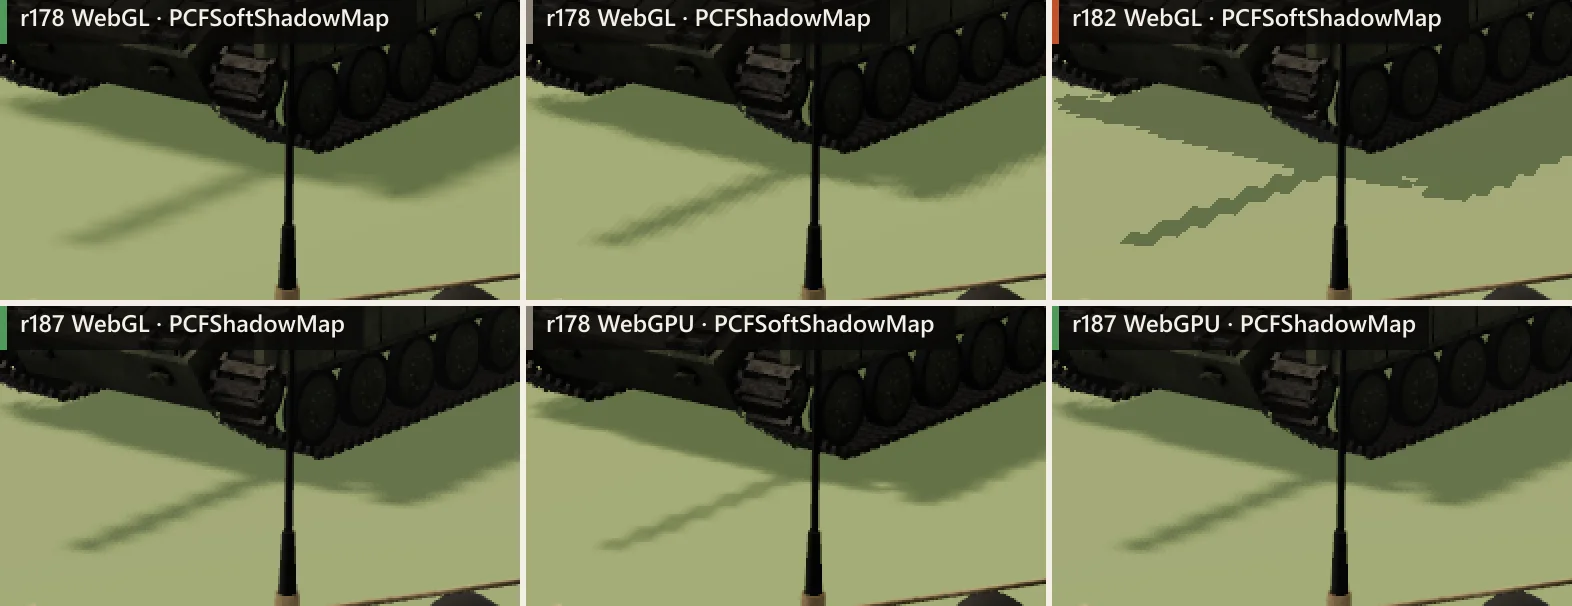
PCFSoftShadowMap, r178 PCFShadowMap, r182 PCFSoftShadowMap (the bug). Bottom row: WebGLRenderer r187 PCFShadowMap, WebGPURenderer r178 PCFSoftShadowMap, WebGPURenderer r187 PCFShadowMap.PCF (percentage-closer filtering) softens shadow edges by comparing several nearby shadow-map texels against the surface depth and averaging the results. Two separate things happened to it around r182, and the forum threads tend to mix them up.
1. A bug: PCFSoftShadowMap in WebGLRenderer r182 gave unfiltered, pixelated shadows. r182 deprecated PCFSoftShadowMap and meant to fall back to PCFShadowMap. The fallback checked the wrong object:
// three.js r182, src/renderers/webgl/WebGLShadowMap.js
this.render = function ( lights, scene, camera ) {
  ...
  if ( lights.type === PCFSoftShadowMap ) {   // `lights` is the array of lights, not the shadow map
    warn( 'PCFSoftShadowMap has been deprecated. Using PCFShadowMap instead.' );
    lights.type = PCFShadowMap;
  }
The condition is never true, so shadowMap.type stayed PCFSoftShadowMap, for which the new shader no longer had a filter; the result looks like BasicShadowMap (top right). r187 checks this.type, warns and uses PCF. On r182 with PCFSoftShadowMap, switch to PCFShadowMap or upgrade.
2. A new PCF filter, in both renderers. Up to r181, WebGLRenderer’s PCFShadowMap averaged 17 point comparisons, and PCFSoftShadowMap blended 16 comparisons bilinearly. Since r182 PCFShadowMap takes five comparison samples from a sampler2DShadow with linear filtering, so the hardware filters each one across neighbouring texels, placed on a Vogel disk and rotated per pixel by interleaved gradient noise (vogelDiskSample, interleavedGradientNoise in shadowmap_pars_fragment and ShadowFilterNode). The result is softer than the old PCF, with a grainy rather than smooth penumbra — what people describe as “noisier” shadows. WebGLRenderer and WebGPURenderer now use the same filter, so r187 shadows match between them (bottom left vs bottom right); in r178 WebGPURenderer’s PCFSoft looked different from WebGL’s.
| If shadows look… | Try |
|---|---|
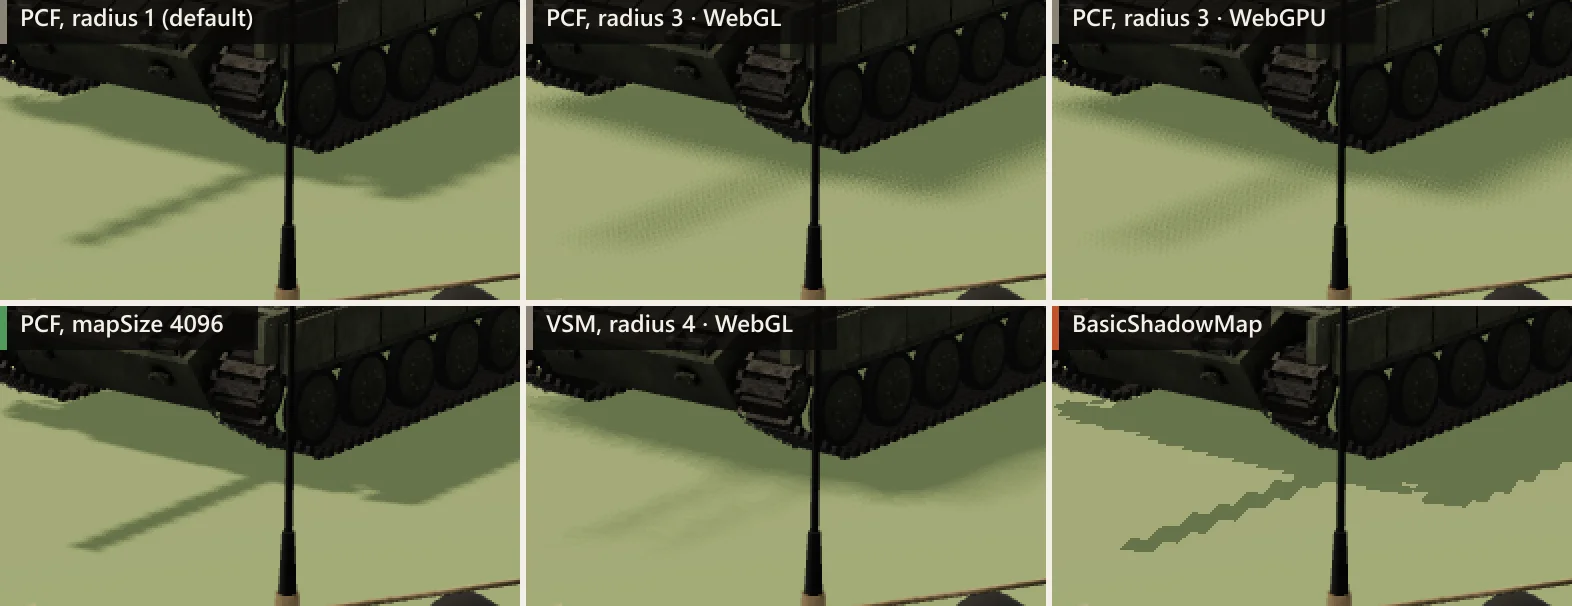
| Grainy at the edge | Keep radius at 1–2; TAA or a post blur hides the noise; a larger map narrows the grainy band |
| Blocky or stair-stepped | r182 with PCFSoft, or Basic: switch to PCFShadow |
| Blurry overall | The shadow camera is too large: fit shadow. left/right/top/bottom to what the viewer sees |
| Acne or peter-panning after an upgrade | r183 changed WebGPURenderer shadow sampling; the migration notes suggest reducing old bias values |
r172 → r187: is it getting faster?
Scroll the chart sideways →
The town by three.js release: CPU time of render() per frame
- WebGLRenderer
- WebGPURenderer (WebGPU)
[email protected] … 0.187.0). Medians of 3 runs, runs interleaved. Intel Core i7-13700H, NVIDIA GeForce RTX 4060 Laptop GPU, Chrome 156, Windows 11, three.js r187, 1600×900, MSAA 4×.All values
| Release | WebGL CPU | WebGPU CPU | ratio | WebGL first frame | WebGPU first frame |
|---|---|---|---|---|---|
| r172 | 19 ms | 33 ms | 1.8× | 928 ms | 1.7 s |
| r178 | 19 ms | 40 ms | 2.1× | 842 ms | 2.0 s |
| r182 | 21 ms | 41 ms | 2.0× | 1.0 s | 1.8 s |
| r187 | 18 ms | 38 ms | 2.1× | 648 ms | 1.3 s |
Forum threads from r182 and r183 reported WebGPURenderer regressions, and the maintainers answered that fixes were on the way. On our scene, with identical code, WebGPURenderer took 33 ms in r172, 40 ms in r178, 41 ms in r182 and 38 ms in r187; WebGLRenderer 19 ms, 19 ms, 21 ms and 18 ms. WebGPU first frames: r172 1.7 s, r178 2.0 s, r182 1.8 s, r187 1.3 s.
The ratio stayed between 1.8× and 2.1× across these releases. r187 was a little faster than r182 on the CPU and clearly faster to the first frame (1.3 s vs 1.8 s), but not faster than r172 on this scene. Draw-call counts are only comparable within r187: older WebGLRenderer releases reset info after the shadow pass and do not count it.
Frequently asked questions
Is three.js WebGPURenderer faster than WebGLRenderer?
Not in our test of a scene made of thousands of separate meshes: on one Windows laptop, r187 WebGPURenderer used 1.7× the CPU time per frame. With instancing and BundleGroup it dropped to 3.0 ms, below WebGLRenderer with the same instancing. Results on other hardware may differ.
Why is WebGPURenderer slow with many meshes?
In our profile the extra time was per object: change detection on every render object, a uniform buffer and bind group per object, and several WebGPU calls per draw. We measured about 3.0 µs per mesh per frame against 1.5 µs for WebGLRenderer.
Why does the first frame take so long with WebGPURenderer?
The first render builds every render pipeline and uploads all textures and buffers. A repeat visit with the browser’s shader cache cut it from 1.7 s to 767 ms in our test. await renderer.compileAsync(scene, camera) shortens the longest main-thread block (732 ms → 279 ms) but not the total wait.
Why did my shadows get pixelated in three.js r182?
In r182 WebGLRenderer, PCFSoftShadowMap was deprecated but its fallback checked the wrong variable, so shadows rendered unfiltered. Use PCFShadowMap (soft since r182) or upgrade.
Does WebGPURenderer support ShaderMaterial and onBeforeCompile?
No. ShaderMaterial is not rendered (with a warning) and onBeforeCompile is ignored without a warning. Port custom shaders to node materials with TSL.
Sources
- three.js r187 — Renderer.js (output pass, compileAsync, _renderBundle, init requirement)
- three.js r187 — Animation.js (NodeFrame.update once per animation frame)
- three.js r187 — UniformGroupNode.js (objectGroup: uniform buffer per object)
- three.js r187 — BundleGroup.js
- three.js r182 — WebGLShadowMap.js (PCFSoftShadowMap fallback)
- three.js r178 — shadowmap_pars_fragment (17-sample PCF, PCFSoft)
- three.js r187 — shadowmap_pars_fragment (Vogel disk + interleaved gradient noise PCF)
- three.js r187 — ShadowFilterNode.js (WebGPU PCF and VSM filters)
- three.js — Migration Guide (r182 PCFSoftShadowMap, r183 shadows and RenderPipeline)
- three.js issue #30560 — WebGPURenderer: UBO system performance with many render items
- three.js issue #32591 — PCFSoftShadowMap shadows pixelated in r182
- three.js issue #33685 — r184: first-frame stutter with a large number of meshes
- three.js forum — [WebGPU] Significant performance drop and shadow quality regression in r182
- three.js forum — WebGPU performance issue
- three.js forum — Why WebGPURenderer performance significantly lower than WebGLRenderer?
- WebGPU specification — GPURenderBundle
- Jimenez — Interleaved gradient noise (Next Generation Post Processing in Call of Duty: Advanced Warfare, 2014)