Removing a model from the scene and freeing its memory are different jobs. scene.remove() only detaches; GPU buffers, textures and shader programs are released by dispose() on the geometry, material and textures; and the CPU-side data goes away only when your code stops referencing it. We loaded and unloaded the whole Military pack (8,222 meshes) ten times per strategy in Chrome: remove-only grew Chrome’s memory by about 594 MB per load, a full dispose stayed flat, and a full dispose with the gltf still referenced grew by about 509 MB per load — mostly retained in the tab as decoded images, geometry arrays and the object graph.
Three separate jobs: detach, free the GPU, drop references
Every forum thread on this topic mixes up three separate things. Getting rid of a model takes all three:
- Detach it —
scene.remove(model)ormodel.removeFromParent(). It stops being drawn. Nothing is freed. - Free its GPU resources —
geometry.dispose(),material.dispose(),texture.dispose()for every texture the materials use, plus a few object types with their owndispose()(skeletons, instanced and batched meshes, lights with shadows). The renderer, not the scene, owns these resources, so only these calls release them. - Drop the references — so the garbage collector can free the JavaScript side: geometry arrays, decoded images, the object graph. Anything that still points at the model keeps all of that alive: a cache, a store, an
AnimationMixer, an event handler.
For a model that owns all of its resources (nothing shared with other models), the whole job is short. The full helper, with the cases it covers, is further down:
disposeObject(model);   // dispose geometries, materials, textures, skeletons; then detach
model = null;           // and remove it from every cache, store and list you keep
Shared resources change the rule: dispose a geometry, material or texture only when every model using it is gone. If you dispose too early, ordinary geometries and textures are re-uploaded on the next frame from the data still in memory (you pay the upload again); resources whose source data no longer exists — a closed ImageBitmap, the contents of a render target — cannot be restored that way.
A few terms used below. Private bytes: memory committed by one process, as Windows Task Manager reports it. GPU process: the Chrome process that executes WebGL commands; the tab’s own process (the renderer process) runs your JavaScript. VAO: a vertex array object, the GPU-side record of which buffers feed a draw call; three.js caches one per geometry and program. Backing store: the memory behind a typed array, which is not counted in the JS heap size. Source: the three.js object holding a texture’s image; several Texture objects can share one. PMREM: the pre-filtered environment map three.js builds for image-based lighting, stored in a render target.
What we measured, in one table
The rest of the article shows how each number was obtained. All of them come from one machine and one browser (details below). “Growth per load” is the slope after the first cycle: (value after unload 10 − value after unload 1) / 9, of Chrome’s GPU-process plus tab private bytes unless the row says otherwise.
Scroll the table sideways for all columns →
| You do | What stays in memory | Growth per load (measured) | Fix |
|---|---|---|---|
scene. only | Vertex and index buffers (CPU and GPU copies), held by three’s VAO cache | +594 MB | Dispose geometry, materials, textures, then remove |
geometry. + material. | GL textures until GC collects their Texture objects | +19 MB after forced GC; renderer. +83 | Dispose every texture of every material |
Full dispose, but the app keeps the gltf | Decoded images (Image) and geometry arrays | +509 MB (tab +490 MB) | Drop the reference |
THREE. with GLB files | Every embedded image, under a one-off blob URL | +327 MB | THREE., or keep the cache off for GLB |
Shared Animation, no uncache | Every character’s object graph | Tab +83 MB per 100 characters (+24 MB with uncache) | mixer. |
New Effect on every resize | Render targets of passes you did not dispose | renderer. +12 per rebuild | Dispose every pass; better, create once and set |
Remove the canvas, leave set running | The whole context | ~160 MB dedicated GPU memory per mount; Chrome dropped the oldest context once 16 were alive | set, dispose(), force |
WebGL allows browsers to delete GPU objects whose JavaScript wrappers have been garbage-collected, and in our runs Chrome did — that is why some rows look harmless after a forced GC. When and whether that happens is not something your app controls. Dispose explicitly; treat the GC clean-up as a safety net, not a strategy.
What one pack load puts on the GPU

catalog.glb, all 54 vehicles in one 28 MB file (Draco geometry, WebP textures). The HUD values come from renderer.info in the same frame.Parsing a GLB creates plain JavaScript objects: BufferGeometry with typed arrays, materials, Texture objects wrapping decoded images. In the plain loading path used here — no compileAsync() or initTexture() beforehand — nothing reaches the GPU until the first render() that draws them. That frame uploads the attribute and index arrays into GL buffers, the images into GL textures, and compiles a shader program per material configuration. For this pack:
| Thing | Count | Where it lives after the first frame |
|---|---|---|
| Meshes | 8,222 | Scene graph (JS) |
| Triangles | 1.57 M | — |
Geometries uploaded (renderer.) | 4,520 | GL buffers ≈ 103 MB, plus the original typed arrays in JS |
Texture objects | 161 | JS; many are clones sharing one image |
| Images drawn | 83 | GL textures ≈ 331 MB if stored as RGBA8 with mipmaps (our estimate) |
GL textures (renderer.) | 85 | Includes the shadow map and environment map |
Shader programs (renderer.) | 13 | GPU process; shared by every material with the same configuration |
Two details matter later. Three.js keeps both copies of geometry: the typed arrays stay in JavaScript after upload, so you can modify them and re-upload with needsUpdate. And renderer.info.memory is a pair of counters — incremented when three creates a GL resource, decremented in the dispose handlers. It knows nothing about bytes, and nothing about resources the browser deletes on its own.
geometry.dispose()  // deletes the GL buffers of its attributes and its VAOs
material.dispose()  // releases its shader program (deleted when no material uses it)
texture.dispose()   // deletes the GL texture (when no other Texture shares the image)

// The JavaScript objects stay intact: arrays and images remain,
// and if the object is rendered again three.js uploads it again.Object3D, Mesh and Scene have no dispose(), and the renderer does not track scene membership. material.dispose() does not dispose the material’s textures — three.js cannot know whether another material shares them.
How we measured
Measured on 2026-11-10: NVIDIA GeForce RTX 4060 Laptop GPU (driver 32.0.15.6626), Intel Core i7-13700H, Windows 11, Chrome 156 via Playwright with hardware WebGL 2 (ANGLE → Direct3D 11), shader disk cache disabled, three.js r180. Canvas 1600×900, pixelRatio 1, MSAA on, PCF soft shadows with a 2048² map, a PMREM environment from RoomEnvironment.
One cycle: load catalog.glb with a fresh GLTFLoader parse (every cycle creates new geometries, materials and textures, like reloading a level), render two frames, unload with the strategy under test, render one frame without the pack (ending in gl.readPixels to wait for the GPU). Then a Node script waits 300 ms, sends HeapProfiler.collectGarbage three times over the DevTools protocol, and reads:
- JS heap —
Runtime.getHeapUsage. Typed-array backing stores and decoded images are not part of it. - Private bytes of Chrome’s GPU process and of the tab’s renderer process (
Get-Process; process ids fromSystemInfo.getProcessInfo). - Dedicated and shared GPU memory of the GPU process — the Windows
GPU Process Memoryperformance counters, the same source as the GPU columns in Task Manager. This is a separate metric from private bytes, not a part of it; we report it in its own column. renderer.info, andWeakRefsurvivors: every geometry, attribute, material, texture andImageBitmapof every load was tracked with aWeakRef, so after GC we know which objects were still reachable.
Each strategy ran in a fresh browser, ten cycles. Three strategies were repeated with no forced GC at all, to see what happens when the browser decides. The timing tests ran separately (see their captions). Ten cycles show a trend; they do not prove that a line never flattens later.
Chart scrolls sideways · full numbers in the table under it →
Chrome memory after each unload: GPU process + tab, private bytes (lower is better)
- scene.remove() only
- Full dispose, app keeps gltf
- Full dispose, THREE.Cache on
- Full dispose, keeps gltf, bitmaps closed
- geometry + material, textures not disposed
- Full dispose
Every cycle, every strategy (GPU process + tab, MB)
| Strategy | 1 | 2 | 3 | 4 | 5 | 6 | 7 | 8 | 9 | 10 |
|---|---|---|---|---|---|---|---|---|---|---|
| scene.remove() only | 1,718 | 2,378 | 3,011 | 3,639 | 4,267 | 4,911 | 5,409 | 5,888 | 6,534 | 7,069 |
| Full dispose, app keeps gltf | 1,953 | 2,666 | 3,146 | 3,728 | 4,251 | 4,505 | 5,106 | 5,604 | 6,066 | 6,529 |
| Full dispose, THREE.Cache on | 1,796 | 2,288 | 2,631 | 2,987 | 3,289 | 3,015 | 3,843 | 4,104 | 4,460 | 4,743 |
| Full dispose, keeps gltf, bitmaps closed | 1,708 | 1,977 | 2,259 | 2,460 | 2,723 | 2,637 | 2,965 | 3,152 | 3,340 | 3,482 |
| geometry + material, textures not disposed | 1,498 | 1,623 | 1,698 | 1,749 | 1,813 | 1,613 | 1,636 | 1,684 | 1,683 | 1,669 |
| Full dispose | 1,477 | 1,671 | 1,704 | 1,764 | 1,827 | 1,647 | 1,695 | 1,674 | 1,666 | 1,582 |
Cycle 10, metric by metric
| Strategy | GPU process private | GPU process dedicated GPU memory | Tab private | JS heap | renderer.info geometries / textures |
|---|---|---|---|---|---|
| scene.remove() only | 5.4 GB | 1.6 GB | 1.5 GB | 113 MB | 45,182 / 832 |
| Full dispose, app keeps gltf | 1.4 GB | 627 MB | 5.0 GB | 349 MB | 2 / 2 |
| Full dispose, THREE.Cache on | 1.4 GB | 588 MB | 3.2 GB | 12 MB | 2 / 2 |
| Full dispose, keeps gltf, bitmaps closed | 1.4 GB | 587 MB | 2.0 GB | 349 MB | 2 / 2 |
| geometry + material, textures not disposed | 1.4 GB | 599 MB | 233 MB | 12 MB | 2 / 832 |
| Full dispose | 1.3 GB | 615 MB | 229 MB | 12 MB | 2 / 2 |
Three groups emerge. Remove-only and the two kept-reference variants grew steadily for all ten cycles. Full dispose and — unexpectedly — geometry + material without textures stayed flat. Even the flat lines start ~1.0 GB above the empty page; after the first load, allocators in Chrome and the driver appear to keep freed memory for reuse, since later loads fit in the same space. Judge leaks by the slope, not by the first step.
scene.remove() alone: buffers pile up and become unreachable

scene.remove(): the 11th load looks identical, but ten earlier copies are still allocated.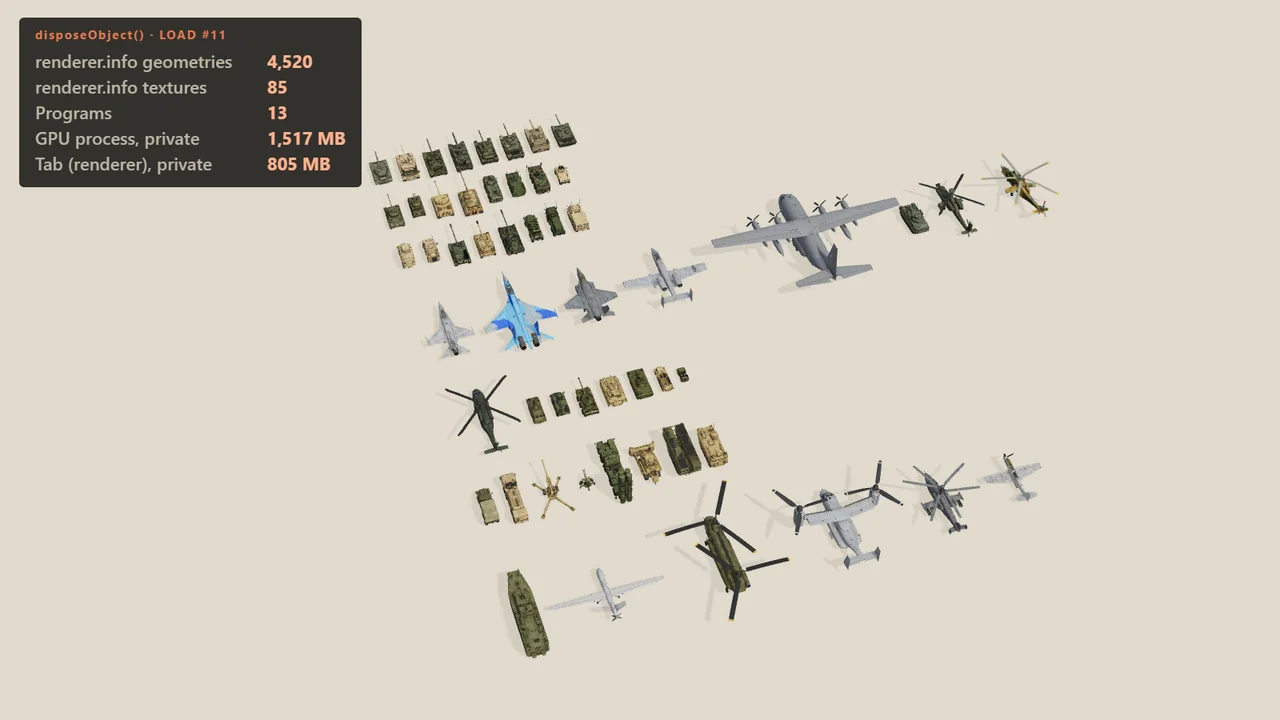
With remove-only, every load added 4,518 geometries and 83 textures to renderer.info, +461 MB to the GPU process and +133 MB to the tab. After ten cycles the two processes held 6.9 GB for a scene that showed nothing.
The WeakRef survivors show where it is held. After GC, 0 of the removed BufferGeometry objects were alive, but 215,540 of their BufferAttribute objects were. The source explains it: WebGLBindingStates, three’s VAO cache, keeps a record per geometry and program of which attributes were bound, with strong references to the attributes, so it can detect changes. geometry.dispose() deletes that record. Without it, the attribute arrays stay in the tab and their GL buffers and VAOs stay in the GPU process.
// three.js r180, WebGLBindingStates.js (abridged)
const bindingStates = {};                        // keyed by geometry.id
function saveCache( object, geometry, program, index ) {
  const cache = {};
  for ( const name in geometry.attributes ) cache[ name ] = { attribute, data };
  currentState.attributes = cache;                // strong references
}
function releaseStatesOfGeometry( geometry ) {   // called by geometry.dispose()
  delete bindingStates[ geometry.id ];
}
Once the BufferGeometry itself has been collected, there is nothing left to call dispose() on, so targeted clean-up is no longer possible. What remains is a full teardown: renderer.dispose() clears all binding states, or you destroy the context. Hence the rule: dispose before you drop the last reference. And do not judge this leak by the JS heap total alone: it grew only +11 MB per cycle, because the bulk sits in typed-array backing stores and in the GPU process. A heap snapshot can still reveal the retained BufferAttributes and their retaining path through the renderer’s cache, but it does not account for GPU-process memory.
Undisposed textures: the counter and the memory disagree
The usual forum snippet disposes geometry and material and stops there. material.dispose() does not dispose textures, so after ten cycles renderer.info.memory.textures read 832 — ten copies of every texture, by three’s count.
Process memory disagreed: after forced GC the geometry + material line is as flat as full dispose (1.6 GB vs 1.5 GB after cycle 10). three.js keeps the WebGLTexture handle in WeakMaps keyed by the Texture and by its Source. When the Texture becomes unreachable, so does the handle, and WebGL implementations may delete objects whose wrappers have been collected; Chrome did. The counter is never decremented because three’s dispose event never fired.
That is not a reason to skip texture.dispose(). The clean-up happens only when a major GC runs, and the JS engine schedules GC by heap pressure — it cannot see that a small Texture object pins megabytes of GPU memory. With GC left to the browser (no forced collections), the same strategy held 2.3 GB after cycle 10, full dispose 2.1 GB and remove-only 7.5 GB — closer than we expected, but a timing result of this run, not a property you can count on. A stale counter also makes renderer.info useless for finding real leaks. Dispose every texture of every material.
One more trap: shared images and KHR_texture_transform produce several Texture objects per image — this pack has 161 for 83 images. three.js shares one GL texture between textures with the same Source and sampling settings and deletes it when the last of them is disposed, so dispose all of them.
Disposed but still referenced: the retained gltf
A correct full dispose does not help if the application still holds the result of loader.loadAsync() — in a cache map, a React state, a store, an undo stack, a closure in an event handler. GPU memory stayed flat (the dispose worked), but Chrome’s memory grew by +509 MB per load, +490 MB of it in the tab, which reached 5.0 GB after ten loads. Only remove-only grew faster.
What is in there: the geometry arrays (~103 MB) and every decoded image. In Chrome, GLTFLoader decodes textures with createImageBitmap, and an ImageBitmap holds uncompressed pixels — 83 WebP files of a few hundred kilobytes each become hundreds of megabytes. The JS heap shows only the wrapper objects (+34 MB per load).
To confirm the split, a variant also closed the bitmaps after disposing the textures. Tab growth fell to +185 MB per load: the images were gone, the geometry arrays and object graph were still held. What to do with this depends on whether the model comes back:
- The model will be shown again (keep it to skip the network and decoder): dispose its GPU resources if memory is tight, but keep the bitmaps open — three.js re-uploads from them. The memory cost above is the price of the fast return.
- The model is discarded for good: dispose, remove every reference, and let GC take the rest. If some code you do not control keeps a reference, closing the model’s bitmaps limits the damage — but the textures cannot be uploaded again afterwards, and the geometry and object graph stay retained until the reference is gone.
// Discarding for good, and only for images no other Texture still needs:
const bitmaps = new Set();
for (const t of textures) {
  if (typeof ImageBitmap !== "undefined" && t.source.data instanceof ImageBitmap) bitmaps.add(t.source.data);
  t.dispose();
}
for (const b of bitmaps) b.close();   // after every texture sharing it is disposed
THREE.Cache.enabled keeps every embedded image
THREE.Cache.enabled = true makes loaders return cached results for URLs they have seen. With GLB files it retains images indefinitely: GLTFLoader turns every embedded image into a temporary blob URL, and ImageBitmapLoader caches the decoded bitmap under that URL. The URL is revoked a moment later and never requested again, but the cache entry stays.
With a full dispose and nothing else retained, the cache variant grew by +327 MB per load (tab +306 MB; 3.2 GB after ten). The 28 MB GLB itself was cached once; the decoded images of every load piled up. If you need the cache for other files, call THREE.Cache.clear() after loading GLBs or when changing levels, or THREE.Cache.remove(key) for specific keys.
When to dispose: what bringing it back costs
“When to dispose” is the other half of the question. For ordinary geometries and textures whose data is still in memory, dispose() is reversible: the next render recreates what is missing. So the question is what that costs. We hid the pack for one frame, optionally disposed one kind of resource, showed it again and timed the frame that brought it back:
Chart scrolls sideways · full numbers in the table under it →
Bringing the whole pack back after one frame away: duration of that frame
- Frame that shows the pack again (render + readPixels)
readPixels synchronisation, not an isolated transfer measurement. The pack is 8,222 meshes and 8,200 draw calls, so an ordinary frame is ~43 ms. “Reload” = fetch from localhost, Draco decode, parse and the first frame. NVIDIA GeForce RTX 4060 Laptop GPU, Chrome 156, ANGLE → Direct3D 11, Windows 11, three.js r180.All repeats
| Variant | Repeats (ms) |
|---|---|
| visible = false, then true | 48, 48.4, 42.9, 39.7, 46, 41.5 |
| remove(), then add() | 38.7, 40.5, 39.9, 36.7, 39.6, 40.3 |
| Materials disposed | 121.2, 116.1, 128, 114.1, 116, 121.1 |
| Textures disposed | 163.5, 165.5, 156.5, 156.2, 155.9, 173.1 |
| Geometries disposed | 934, 1126.4, 1351.7, 1280.5, 1308.9, 1310.8 |
| Geometry + material + texture disposed | 1286, 1212, 1098.8, 1094.4, 1019.4, 1062.9 |
| Full dispose + load the GLB again | 1802.5, 2075.4, 1935.9, 2057.9, 1683.4, 1859.7 |
The restoring frame took ~1.3 s after the geometries had been disposed (re-creating buffers for ~103 MB of data, plus everything else that frame does), ~157 ms after the textures, and ~116 ms after the materials, against ~43 ms for a normal frame. The material case includes recompiling programs, softened by Chrome’s in-memory program cache, and is not a clean compile time. A full reload from the network was ~1.9 s.
- Hiding something that will come back —
visible = falseorremove(), no dispose. Menus, tabs, level sections the player can return to, LOD tiers. - Discarding for good — dispose everything and drop the references. Switching levels, closing a model viewer, replacing a configurator variant.
- In between (may come back in a minute): dispose the GPU resources and keep the scene graph and its images; the return costs one slow frame instead of a download and decode.
Full dispose also releases shader programs, so the next load recompiles them. Over six reloads, the first frame after loading took a median 1.3 s after a full dispose and 634 ms when the previous copy had only been removed and its programs were still alive. await renderer.compileAsync(root, camera, scene) before adding the model took ~92 ms and the first frame then took 989 ms — better, but still above the warm case; we did not isolate the remainder. If reload latency matters more than memory, one option (not measured here) is to keep one material per shader configuration alive between levels.
Skinned characters: skeletons and AnimationMixer
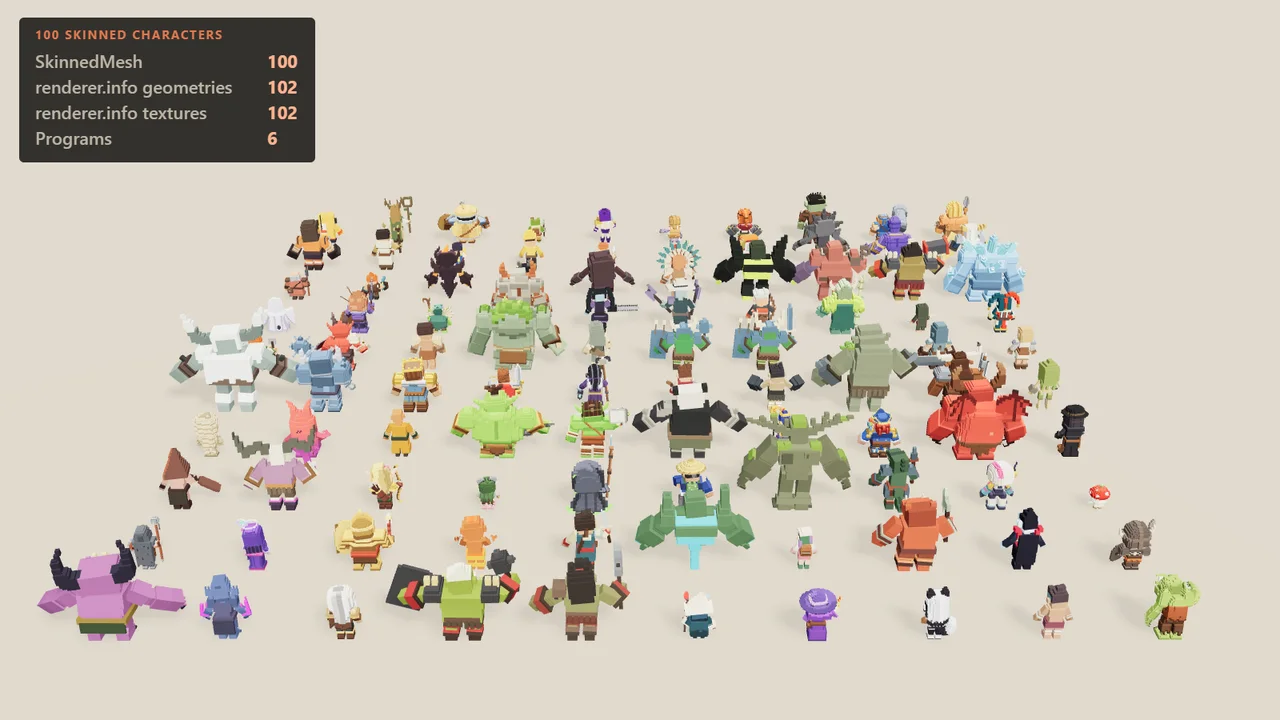
Skinned meshes add two things to clean up. Each SkinnedMesh has a Skeleton whose bone matrices live in a float DataTexture (always, in WebGL 2); skeleton.dispose() deletes it, a geometry-and-material traversal does not. And AnimationMixer caches actions and property bindings per root object.
| Unload strategy (100 characters) | renderer.info textures after 10 cycles | Tab, growth per load | Characters reachable after GC |
|---|---|---|---|
Dispose geometry/materials/textures, no skeleton., per-character mixers dropped | 1,002 | +24 MB | 0 |
Same + skeleton. | 2 | +24 MB | 0 |
| Full dispose, one shared mixer, no uncache | 2 | +83 MB | 1,000 |
Full dispose, shared mixer + uncache | 2 | +24 MB | 0 |
The missing skeleton.dispose() repeats the texture story: the counter climbed by 100 per cycle while process memory matched the full dispose after forced GC. Call it anyway.
The shared mixer is a real retention. A long-lived new AnimationMixer(scene) that plays clips on many roots keeps an action and its bindings for every root it has animated, and the bindings reference the bones, so the whole character stays reachable: after ten cycles all 1,000 characters were alive, 166 MB of JS heap. GPU memory was fine because we had disposed it. mixer.uncacheRoot(root) released them. uncacheClip(clip) is a different tool: it frees a clip’s actions for every root in that mixer, so call it only when no remaining character uses the clip (our test did, because each character had its own clips). Per-character mixers dropped together with the character need no uncaching.
Render targets and EffectComposer
Post-processing allocates render targets: an EffectComposer owns two full-screen targets, UnrealBloomPass eleven more. composer.dispose() releases only the composer’s own targets and its copy pass; the passes you added are yours to dispose. We rebuilt or resized a bloom composer ten times, in two sequences: a real resize that alternates between 1600×900 and 1560×876, and a rebuild at an unchanged size.
| Strategy | renderer.info textures after 10 | Dedicated GPU memory per step: real resize | Same size every time |
|---|---|---|---|
| New composer + passes, nothing disposed | 122 | +41 MB | +40 MB |
composer., then new | 113 | +42 MB | +44 MB |
Every pass. + composer., then new | 14 | +42 MB | +28 MB |
One composer, composer. | 14 | +42 MB | flat (+2 MB) |
The counter is clear: undisposed passes add 11 textures per rebuild, and disposing every pass fixes it. The memory is not: with a real resize, all four strategies grew by about the same amount over ten steps, including the reused composer — RenderTarget.setSize() disposes and reallocates whenever the size changes, so a resize reallocates either way. We could not attribute the growth to three.js, and ten steps are not enough to tell whether it would level off. Only the reused composer at an unchanged size stayed flat, which mainly shows that it did no work.
So the defensible advice is about avoiding needless work, not a proven memory fix: create the composer once, call composer.setSize() on a debounced resize so a window drag does not reallocate every frame, and when the viewer goes away dispose every pass and then the composer.
Tearing down the whole viewer
Single-page apps and React components mount and unmount whole viewers. Here a remount means: remove the old canvas, create a new canvas and WebGLRenderer, load a T-90M from the Military pack, start setAnimationLoop. Twenty times, with four teardowns:
Chart scrolls sideways · full numbers in the table under it →
Remounting a viewer 20 times: dedicated GPU memory of Chrome’s GPU process after each mount
- Canvas removed, animation loop still running
- Loop stopped, nothing disposed
- renderer.dispose()
- dispose() + forceContextLoss()
WebGLRenderer, a PMREM environment, one T-90M GLB from the Military pack, setAnimationLoop. The previous viewer is torn down first with the listed strategy. Measured after forced GC. NVIDIA GeForce RTX 4060 Laptop GPU, Chrome 156, ANGLE → Direct3D 11, Windows 11, three.js r180.Contexts and memory after mount 20
| Teardown | Dedicated GPU memory | GPU process private | Contexts lost | Browser warnings |
|---|---|---|---|---|
| Canvas removed, animation loop still running | 2.5 GB | 3.3 GB | 4 | 4 |
| Loop stopped, nothing disposed | 190 MB | 797 MB | 0 | 0 |
| renderer.dispose() | 190 MB | 772 MB | 0 | 0 |
| dispose() + forceContextLoss() | 188 MB | 802 MB | 19 | 0 |
The animation loop is a strong reference. setAnimationLoop(fn) registers a requestAnimationFrame callback that closes over the renderer, scene and camera. Removing the canvas does not stop it, so nothing could be collected: each mount added ~160 MB of dedicated GPU memory until, with 16 contexts alive, Chrome printed WARNING: Too many active WebGL contexts. Oldest context will be lost. and started dropping the oldest — 4 contexts lost by mount 20. That limit is what this Chrome build did on this machine, not a number to design around; if a dropped context belongs to a viewer still on screen, that viewer goes blank.
With the loop stopped, everything was reclaimed by GC in this run, with or without renderer.dispose(). dispose() clears three’s internal caches (render lists, programs, binding states, properties) and stops the loop, but does not delete geometries and textures you did not dispose and does not release the context. renderer.forceContextLoss() releases it right away: 19 webglcontextlost events for 19 teardowns. Without forced GC, the undisposed and dispose()-only variants kept up to one extra context alive at a time (dedicated GPU memory alternating between 190 MB and 356 MB), while forceContextLoss() stayed at 188 MB.
A teardown that releases what it owns — note that the PMREM result is a render target, so keep the target, not just its texture:
// when creating the viewer
const pmrem = new THREE.PMREMGenerator(renderer);
const envTarget = pmrem.fromEquirectangular(hdrTexture);   // a WebGLRenderTarget
pmrem.dispose();
hdrTexture.dispose();
scene.environment = envTarget.texture;

function destroyViewer(v) {
  v.renderer.setAnimationLoop(null);      // stop rendering before releasing resources
  disposeObject(v.model);                  // the helper below
  v.scene.environment = null;
  v.envTarget.dispose();                   // the render target: texture + framebuffer
  for (const p of v.composer?.passes ?? []) p.dispose?.();
  v.composer?.dispose();
  v.controls?.dispose();                   // OrbitControls listeners on the canvas
  v.renderer.dispose();
  v.renderer.forceContextLoss();           // release the context now, not at some later GC
  v.renderer.domElement.remove();
}
A dispose helper, and the ownership rule that comes first
The ownership rule first. The helper disposes everything it finds under root. Use it only on a subtree that owns its resources. Geometries, materials and textures shared with models that stay on screen — clones from SkeletonUtils.clone(), a material library reused across levels — must be excluded or reference-counted; dispose them when their last user goes. For ordinary geometries and textures an early dispose costs an upload; for closed bitmaps or render-target contents it loses data.
Within that rule, the helper collects resources into sets first, so geometries, materials, textures and skeletons shared inside the subtree are disposed once. It handles material arrays, every texture property of a material (it scans the material’s own properties rather than a fixed list), texture-valued and texture-array uniforms of ShaderMaterial, skeletons, the extra GPU buffers and textures of InstancedMesh and BatchedMesh, and shadow maps of lights inside the subtree:
export function disposeObject(root, { closeBitmaps = false } = {}) {
  const geometries = new Set(), materials = new Set(), textures = new Set(), skeletons = new Set();
  const addTexture = (v) => {
    if (v?.isTexture) textures.add(v);
    else if (Array.isArray(v)) v.forEach(addTexture);    // e.g. uniform { value: [a, b] }
  };
  root.traverse((o) => {
    if (o.geometry && !o.isBatchedMesh) geometries.add(o.geometry); // BatchedMesh.dispose() frees its own
    if (o.material) for (const m of [].concat(o.material)) materials.add(m);
    if (o.isSkinnedMesh) skeletons.add(o.skeleton);        // bone DataTexture, may be shared
    if (o.isInstancedMesh || o.isBatchedMesh) o.dispose(); // instanceMatrix/instanceColor buffers, morph/data textures
    if (o.isLight) o.dispose();                            // shadow map
  });
  for (const m of materials) {
    for (const v of Object.values(m)) addTexture(v);
    if (m.uniforms) for (const u of Object.values(m.uniforms)) addTexture(u?.value);
    m.dispose();
  }
  for (const g of geometries) g.dispose();
  for (const sk of skeletons) sk.dispose();
  const bitmaps = new Set();
  for (const t of textures) {
    if (closeBitmaps && typeof ImageBitmap !== "undefined" && t.source.data instanceof ImageBitmap) bitmaps.add(t.source.data);
    t.dispose();
  }
  for (const b of bitmaps) b.close();   // only when the model is discarded for good
  root.removeFromParent();
}
The bench used an earlier version of this function without the instanced, batched, light and uniform-array branches; the test assets contain none of those, so the measurements are unaffected. Outside the helper’s reach: scene.background and scene.environment and the render targets behind them, render targets you created yourself, AnimationMixer caches, controls’ event listeners, and your own maps and stores.
How to check your own app
Our numbers describe one pack on one machine. To test your own app:
- Pick one repeatable cycle that should end where it started: open and close a model, enter and leave a level, mount and unmount the viewer.
- Warm up: run it two or three times first. The first pass allocates caches and pools that later passes reuse.
- Run it 10–20 more times, recording after each cycle the
renderer.info.memoryandrenderer.info.programs.lengthvalues, plus the tab and GPU process memory from Chrome’s Task Manager (Shift+Esc). For the JS side, use DevTools → Memory and click the bin icon (collect garbage) before reading. - Remove diagnostic retention before judging: console-logged objects,
window.debughandles, DevTools selections and devtools extensions all keep objects alive. - Read the trend, not the first step. A flat line after warm-up is fine. Sustained growth is a reason to investigate: check whether it comes from retained objects, expanding caches, delayed reclamation or GPU allocations (our composer test grew for a reason we could not pin down).
- Find the retainer. Take a heap snapshot after the warm-up and another after several cycles, compare them, and follow the retaining path of a growing class (
BufferAttribute,Texture,Mesh) back to your code — a cache, a mixer, a closure. A growingrenderer.infocounter with a flat process memory points to a missingdispose()that GC happened to cover.
Checklist
- Dispose before you drop the last reference: geometries, materials, every texture, skeletons, instanced meshes — then detach.
- Respect ownership: never dispose resources a model on screen still uses.
- Do not read
renderer.info.memoryas memory. It tracks resource counts maintained by three.js, not bytes, and misses what the browser frees on its own; check process memory too. - After disposing, remove every reference to the
gltf. Close its bitmaps only when it is discarded for good. - Keep
THREE.Cacheoff for GLB files, or clear it on level changes. - Shared
AnimationMixer:uncacheRoot()each discarded root;uncacheClip()only for clips nobody uses. - Post-processing: one composer, debounced
setSize(); on teardown dispose every pass, then the composer. - Viewer teardown:
setAnimationLoop(null), dispose the scene and the PMREM render target,renderer.dispose(),forceContextLoss(). - Hide what will come back; dispose what will not.
Frequently asked questions
Does scene.remove() free memory in three.js?
No. It only detaches the object. The renderer keeps the GL buffers, textures and programs until you call dispose() on the geometry, material and textures. In our bench remove-only grew Chrome’s memory by about 594 MB per load, and because three’s VAO cache keeps the vertex attributes alive after the geometry object is gone, it could no longer be cleaned up per object afterwards.
Does material.dispose() dispose its textures?
No. Textures can be shared between materials, so three.js leaves them to you: call texture.dispose() for every texture the material uses. Browsers may delete GPU textures whose JavaScript objects were garbage-collected — Chrome did in our test — but that depends on GC timing and is not something to rely on.
Why does renderer.info.memory.textures keep growing?
Because textures are created and never disposed; three.js decrements the counter only in its dispose handler. The memory itself may already have been reclaimed by GC, so the counter can grow while process memory stays flat. Treat it as a missing dispose() call and check process memory.
Do I need to dispose objects I will add back later?
No — hide or remove them and keep the GPU resources. For ordinary geometries and textures disposing is reversible, but bringing them back costs time: in our test the frame that restored a 54-vehicle pack took ~1.3 s after its geometries had been disposed, against ~43 ms normally.
Is it safe to dispose a texture or material that another mesh still uses?
Dispose shared resources only after every user is done with them. If you dispose early, ordinary geometries and textures are re-uploaded from the data still in memory on the next render, at the cost of the upload or compile. Resources without that data — a texture whose ImageBitmap was closed, the contents of a render target — cannot be restored that way.
Does renderer.dispose() free all GPU memory?
No. It clears three.js’s internal caches and stops the animation loop, but does not delete geometries and textures you did not dispose and does not release the WebGL context. Call renderer.forceContextLoss() after it to release the context immediately.
Do I need to dispose when the user closes the page?
No. Closing or navigating away destroys the context and everything in it. Disposal matters for single-page apps, level changes, model viewers that swap models, and components that mount and unmount.
Sources
- three.js manual — How to dispose of objects
- three.js r180 — WebGLGeometries.js (geometry dispose, info.memory.geometries)
- three.js r180 — WebGLBindingStates.js (VAO cache keyed by geometry.id)
- three.js r180 — WebGLTextures.js (texture and render target dispose, shared Source handling)
- three.js r180 — WebGLObjects.js (InstancedMesh dispose: instance buffers)
- three.js r180 — InstancedMesh.js
- three.js r180 — WebGLRenderer.js (dispose, forceContextLoss, material dispose)
- three.js r180 — RenderTarget.js (setSize reallocates on size change)
- three.js r180 — PMREMGenerator.js (returns a WebGLRenderTarget)
- three.js r180 — ImageBitmapLoader.js (Cache keys)
- three.js r180 — EffectComposer.js (dispose)
- three.js r180 — UnrealBloomPass.js (dispose)
- three.js r180 — AnimationMixer.js (uncacheRoot, uncacheClip)
- Khronos — WebGL 1.0 specification (object lifetime)
- Microsoft DirectX blog — GPUs in the Task Manager (dedicated and shared GPU memory)
- three.js forum — When to dispose: How to completely clean up a Three.js scene
- three.js forum — Correctly remove mesh from scene and dispose material and geometry
- three.js forum — Dispose things correctly in three.js